? Practical skills assessed in the practical endorsement (FREE TO VIEW)

The A Level Biologist - Your Hub February 24, 2020
Independent thinking
This refers to you having the knowledge and confidence to approach a problem or experiment with common sense. It refers to you taking it upon yourself to understand the background, what is going on and what you might be able to do. Ask questions, find out information, update it as you go along. It’s not a test to trip you up, simply material with which you can toy.
Looking things up that you don’t understand is a fundamental unit of not just the A level science, but research itself at the highest level. Research literally means looking things up. Having no clue what is going on is the default. You are not learning random bits of stuff, you are learning how to learn anything.
And how to learn anything requires independent thinking. Binge on it!
Applying investigative approaches refers to the general pattern of findings things out and following up on them. It is part of the overarching cycle of the scientific process.
Use and application of scientific methods and practices
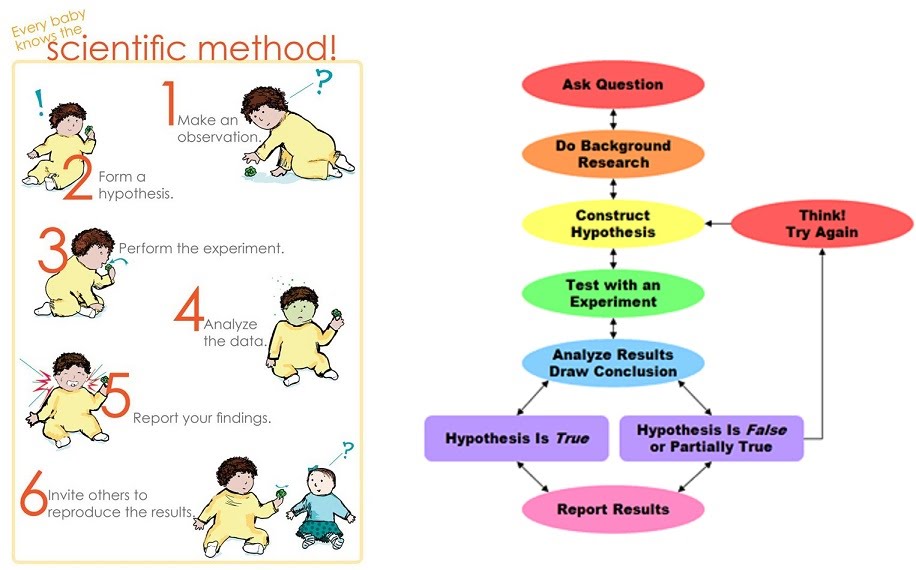
The method
Science provides models for harnessing knowledge in a relatively objective, material and quantified environment. It involves high levels of reproducibility and peer-to-peer confirmation of findings, and as such can produce very widely applicable and powerful knowledge. The downside to this is that due to its basis of formulating testable hypotheses, many types of knowledge remain outside of the working field of science.
Starting out with an idea based on previous knowledge or new observation, a testable hypothesis is established as the foundation for experimentation. Hypotheses are statements to be tested. For example, “cats don’t have a food preference” is a testable hypothesis for an animal shelter in the UK, but would not be a testable hypothesis somewhere where there are no cats. A hypothesis might not be testable due to abstract constraints e.g. “people are not happier on the Moon than on Earth”, or due to the limitations of human existence at a given time e.g. time, money, politics, priorities, taboos, etc.
The default hypothesis in any case is the null hypothesis that states no change will be observed. For example, “cats don’t have a food preference for wet or dry food” is the null hypothesis. “Cats prefer wet food to dry food” is its counterpart alternative hypothesis. A statistical test on data obtained from experiments might show that the null hypothesis is to be accepted or rejected.
Once within the space of a testable hypothesis, experimental design follows. This is a preparatory exercise ahead of experimentation that ensures the experiments and outcomes are what they need to be. Experiments must adhere to guidelines such as risk assessment, reproducibility and validity or results, time and cost effectiveness, etc. For example, in a clinical trial where clinicians administer drugs and placebos randomly to patients, a double-blind experimental design is required where neither the clinicians nor the patients are aware of whether they are assigned the drug or the placebo.
Experimental design covers the equipment and reagents needed and whether these are safe and cost-effective enough to justify their use; what experiments will be carried out, when, in what order, how and how many times; what data will need to be recorded; what biases might arise and how to counteract them e.g. labelling tests using codes rather than content names; how to organise experiments to fit with experimenter’s schedules or equipment booking schedules; how to collect the right amount of data from experiments to be able to use certain statistical tests afterwards i.e. some tests need a minimum of data to apply.
Obtaining results is the next step. This involves first collecting the data which as previously mentioned, might start right from the experimental design step because sometimes the data might be missed unless specifically waited on to be collected. Sometimes an experimenter might have a split second to collect the data, else the experiment is wasted. This must be planned for in advance. Sometimes equipment collects data automatically in which case one can take a nap.
Either way, once collected, data is kept in a store (whether physical or digital) as raw data. This is then looked at and analysed using various methods such as computing, graph generator software, image processors, etc.
Evaluation of results involves fitting the new data into the existing knowledge. Sometimes this involves discarding what is outlier data, running additional statistical tests to fine tune results, dealing with unexpected results, or outright finding out that the experiment didn’t run as intended.
This feeds into the last step of drawing conclusions and using them to inform the start of a new cycle with a new testable hypothesis. It may be that the failed experiment will be carried out again; a slight variation of the experiment will be carried out again; a different experiment will be carried out; the results support rejecting or accepting the null hypothesis, and a new area of the field can be created with new experiments; the hypothesis is settled and the area is abandoned or paused in the pursuit of a different area of the field; or indeed, the findings break new ground, spawn new directions of research, and inspire innovation, business and citizen interest and application of the new knowledge.
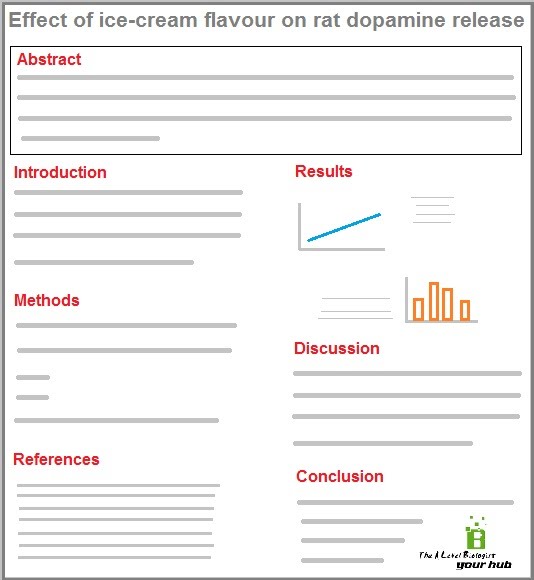
Research and referencing
Research relies on all the sources of information available. There are partially standardised media that specialise in certain areas of research, such as scientific papers (typical layout pictured) in journals, as well as textbooks, websites and other media that are useful at different stages of research, in different contexts and for different purposes. Scientific papers can be extremely technical to the point where only the researchers in that field can understand the content. Textbooks are more accessible and broad.
Presenting results must be done in an unbiased way e.g. showing all results, not cherry-picking, not tweaking data, graphs, images or statistical analyses to show data in a light that isn’t objective.
Presenting new research must credit any previous relevant work with adequate citations and references. Citations are quick, in-text tags to each statement that uses previous work e.g. “This gene showed a marked response in cancerous rats (Name and Other Name, 2001)“.
References are alphabetically-sorted, full-detail lists of the mentioned work, added at the end of the paper e.g.:
Crenshaw, A., Jr., 2012. Surgical techniques and approaches, in: Campbell’s Operative Orthopaedics. Mosby Elsevier.
Domingos, M., Intranuovo, F., Gloria, A., Gristina, R., Ambrosio, L., Bártolo, P.J., Favia, P., 2013. Improved osteoblast cell affinity on plasma-modified 3-D extruded PCL scaffolds. Acta Biomaterialia 9, 5997–6005. doi:10.1016/j.actbio.2012.12.031
Gentile, P., Ghione, C., Tonda-Turo, C., Kalaskar, D.M., 2015. Peptide functionalisation of nanocomposite polymer for bone tissue engineering using plasma surface polymerisation. RSC Adv. 5, 80039–80047. doi:10.1039/C5RA15579G
References contain author name(s), year of publication, paper or book title, pages, and their unique identifier code by which they can be looked up. There are many citation and reference managers (software) such as Zotero (////www.zotero.org/) that can collect and generate references automatically.
Instruments and equipment
The actual use of various instruments and equipment is part of your practicals. Oh wait, no. An experimental bench is about to be summoned onto your computer! This is going to be exciting!
…nope. Nope. Not yet, anyway. Maybe for a later virtual reality plugin.
Still, here are the outlines for the practical techniques listed in the spec.
Various basic properties can be measured using simple (enough) equipment. These are mass, time, volume, temperature, length and pH.
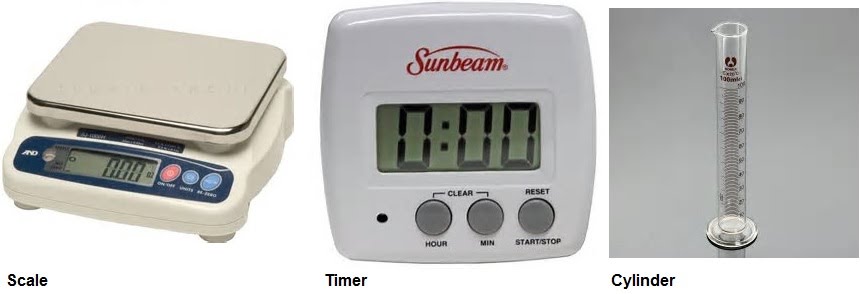
Mass can be measured using scales of various precision e.g. to the gram or to the milligram. Scales must be “zeroed” before weighing anything. Usually they start up at 0, but if they were used to measure something else they might be off. For example, if you need to measure something in a plastic tray (boat), you’d zero the scale with the boat on, and then add your substance. This enables the weighing of the substance without the weight of the boat.
Time can be measured using timers. These can count up, down, with intervals, etc.
Volume can be measured using cylinders, beakers, anything that is graded. Volume of water can also be measured by weight (1 l = 1 kg).
Temperature can be measured using thermometers. Some equipment such as electric heaters, centrifuges, fridges, freezers, autoclaves and shaker incubators have built-in thermometers that display temperature digitally.
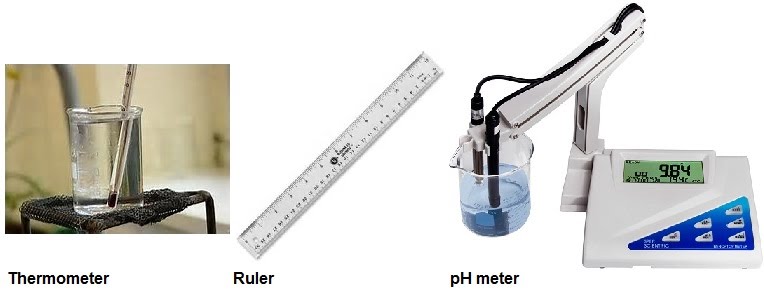
Length can be measured using rulers, tapes or other graded tools.
pH can be measured using a pH meter. This is calibrated using an acid and a neutral or basic solution. Once calibrated, it will measure the pH of the solution that the tip of the meter is placed in. Often, the pH is adjusted at the same time by adding extra acid or base to reach the desired pH. The solution is kept moving through a magnetic stirrer to make sure the pH is even throughout.
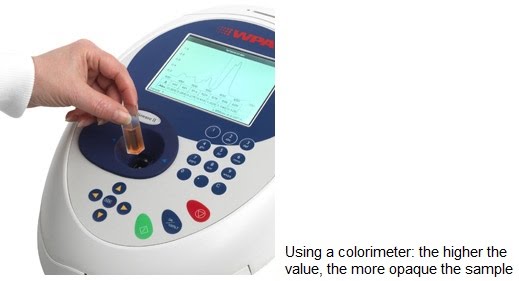
A colorimeter (spectrophotometer) can be used to quantitatively measure how much light of a specific wavelength can pass through a solution. This can be very accurate and measure the number of bacterial cells in a growth culture; protein or DNA concentration in a liquid sample; the progression of a chemical reaction that produces a colour change, etc.
Glassware is used in the lab to hold things. This includes solutions, microorganisms, chemicals, etc. Glassware comes in many shapes and sizes. For example, cylinders are used to measure liquid volumes. Flasks are used to culture bacteria. Beakers are used to prepare solutions. A lot of “glassware” is actually made of plastic. This is especially the case with molecular biology. Glassware is reusable and washable while plasticware isn’t, in the case of contamination-sensitive experiments. Larger plasticware can be washed too and reused.
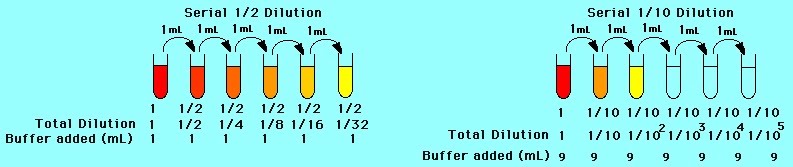
Serial dilutions are carried out using multiple glass or plastic containers. They can be as large as chemistry glass tubes of 50 ml or as small as molecular biology plastic “eppendorfs” with a lid, of just 100 μl volume. Serial dilutions use set numbers as factors for diluting a stock solution. This enables making multiple solutions of decreasing concentration e.g. 2 g/ml; 1 g/ml; 0.5 g/ml; 0.25 g/ml. Buffers are solutions that maintain their pH. They are a basic element of many biological experiments in the lab.
Light microscopes magnify specimens on slides in their field of view to a good resolution so that we can see very small things.
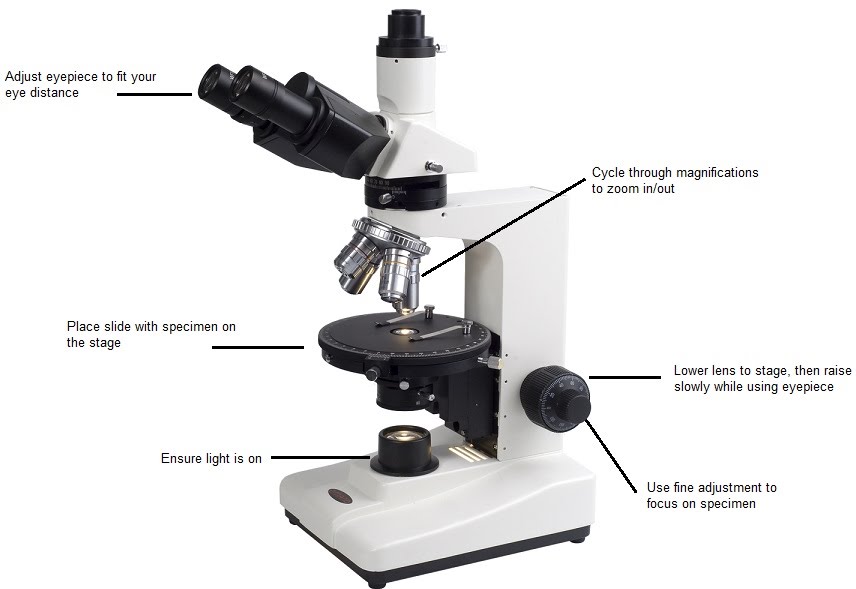
Another practical skill is kind of like the microscope diagram – being able to represent scientific objects, specimens or concepts in drawing and with annotations.
Microscopes can come with a graticule. This is a tiny length measure that can help give a reference to measure the real size of a specimen as seen through the microscope.
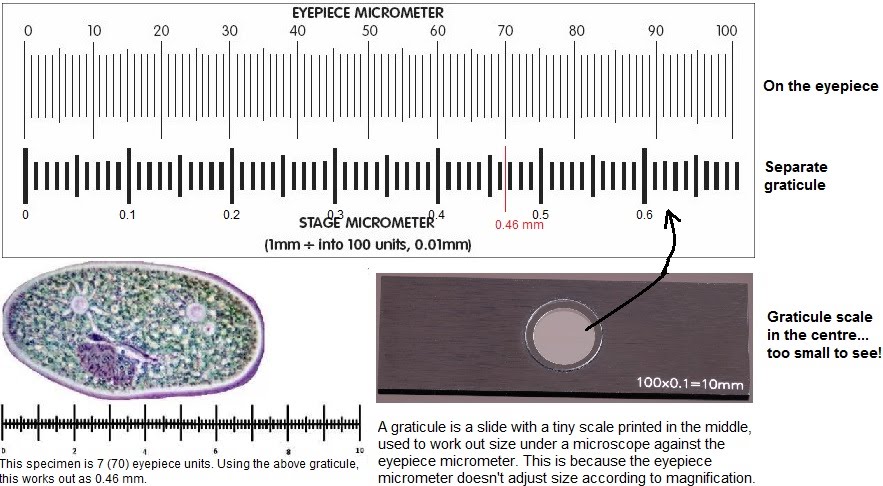
Using a graticule involves first visualising the specimen under the microscope and sizing it using the eyepiece micrometer e.g. 70 units. Then the specimen on the slide is placed aside, and the graticule is set on the microscope stage instead, and aligned with the eyepiece micrometer. The two scales are compared to obtain the real size of the specimen e.g. 70 units = 0.46 mm.
Qualitative tests can be carried out in the lab. These reveal the identity of a substance and whether it is present in a solution. Benedict’s reagent is used to test for reducing sugars. Carbohydrates (sugars) can be chemically reducing or non-reducing. Adding Benedict’s reagent to a test sample can reveal whether it is reducing or non-reducing. Benedict’s reagent is light blue. In the presence of a reducing sugar it will turn orange/brick red. There are many other such tests, like iodine for starch.
Chromatography
In order to separate smaller components, like amino acids and proteins, highly specific methods can be employed, including affinity chromatography. This is more specific than the basic chromatography technique done to separate different chemicals from a mixture e.g. paper chromatography and thin layer chromatography.
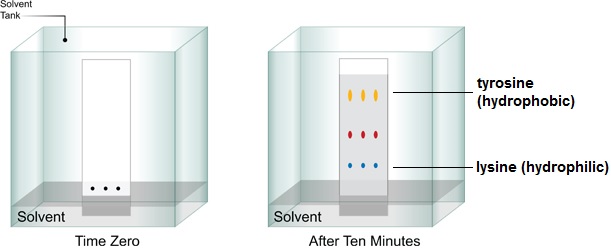
Paper chromatography involves using a defined piece of chromatography paper and placing a droplet of the mixture at the bottom, in the middle of the paper. This section is then immersed in a solvent which is drawn up the section of paper through capillary action. Depending on their chemical properties, some components of the mixture will be drawn up with the solvent, while others will lag behind or not move at all. This separation is enabled by their interaction with the stationary phase (the paper) and the mobile phase (the solvent).
Thin layer chromatography uses the same concept, except it uses an aluminium, glass or plastic layer instead of chromatography paper. It is used more commonly, as paper chromatography has become more of a teaching tool than research tool. Thin layer chromatography can be used in organic chemistry research to indicate whether a starting compound used in reaction has been used up or is still present.
Affinity chromatography is the specific type of chromatography used in molecular biology research, as it enables the separation of given proteins from mixtures of bacterial cell lysates, buffers, etc. The concept of affinity is that some specific property of the target protein (size, presence of tags previously added for this purpose, chemical bonding including hydrogen bonding, disulfide bridges, ionic interactions, etc.) can be used to bind it to a stationary phase, while compounds that do not meet that criteria can be washed away. The protein can then be eluted into a solution that contains the target protein only, resulting in its purification from the original mixture.
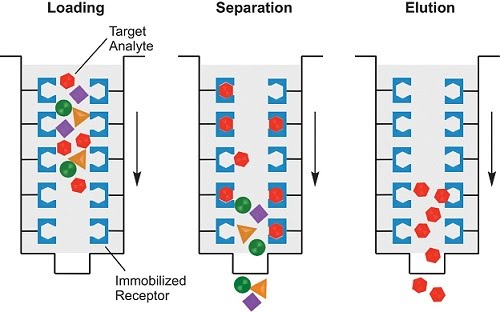
In order to preserve the chemical environment for each step, different buffers are used for loading, washing (separating) and eluting. A common binding tag used to separate proteins is a His tag which consists of 6 histidine amino acids joined together. It can be genetically engineered into any DNA that codes for the target protein. Therefore, the protein will be synthesised with an extra part – the His tag – at the start or end of its sequence. The His tag can then be used to bind the target protein to the stationary phase, and separate it from all the other proteins in the mixture (without the tag) using a nickel column.
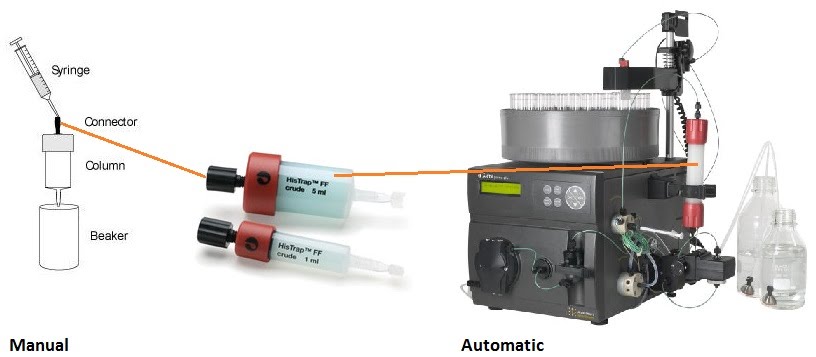
You can see it’s a nickel column just by its blue colour. Purification columns for chromatography come in many shapes and sizes. The smaller ones can be used for small volumes, while the largest ones are used in conjunction with automatic pumping machines.
Manual use involves passing the original mixed solution with the target protein through the column (loading), followed by washing the column multiple times with a special buffer to remove the unwanted components. Lastly, and the most critical step, is elution. This washes away the bound target protein from the column in a yet another specialised buffer, where it can be stored for longer in its purified medium.
Alternatively, all the buffers can be pre-made and used with an automated machine. The machine does all the buffer changing and pumping, and it can even collect fractions of the solutions obtained. Only some of these fractions will contain the target protein.
Electrophoresis
Protein electrophoresis is a method for separating smaller amounts of protein mixtures for the purpose of visualising them by size and charge. The principle is the same as DNA electrophoresis. The mixture is loaded into a porous gel, and a current is passed through it. The proteins travel down the gel, away from the negative end of the current, towards the positive end, as they themselves have a negative charge.
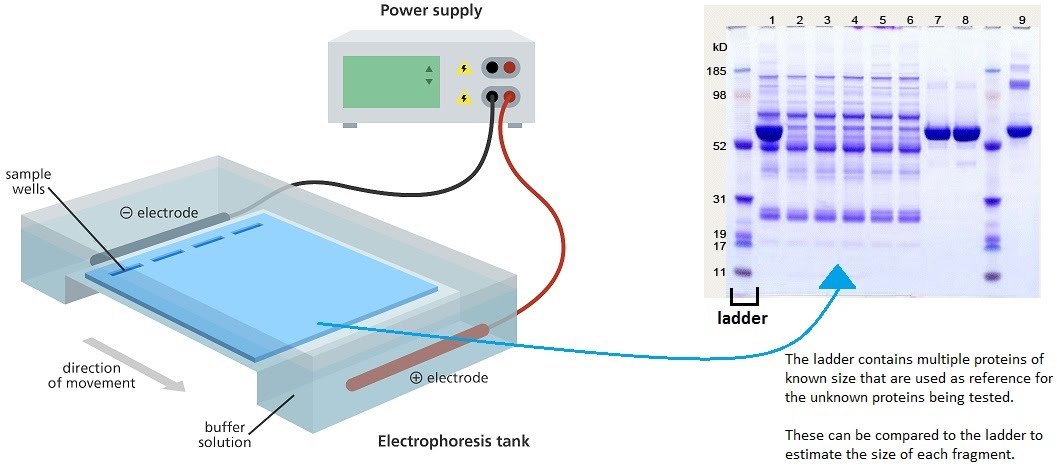
The gel is removed from the tank and stained with a dye to highlight the protein bands. A marker, or ladder, is used adjacent to the tested protein samples in order to provide a reference for the sizes on the gel. As you can see, the smaller fragments travel faster than the larger fragments. This is because smaller fragments can make their way more easily through the gel matrix than larger fragments.
Protein size is measured in Daltons (more specifically, kilodaltons). For example, human insulin is 11.98 kDa. On the gel, it should show up just above the 11 kDa marker, in a parallel lane. Each parallel lane is a separate protein sample.
Using plants and animals safely and ethically
When it comes to experimentation on animals, obvious ethical concerns arise in terms of using animals at all, using animals ethically, and using animals when the benefit outweighs the ethical cost.
A system called replacement, reduction and refinement aims to manage these dilemmas. Before conducting animal experimentation, researchers must justify the experimental design with animals by going through these steps. Replacement asks them if animals can be replaced at all in their experiments with by-product tissues or cells, or other approaches such as in vitro studies, to obtain the same data.
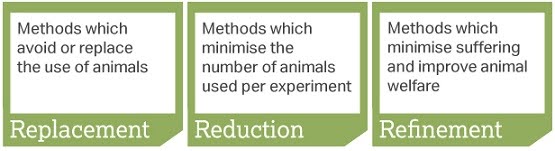
Reduction follows if animal use is the only option, and asks whether there is a way to minimise the use of animals. For example, multiple experiments could be carried out at the same time, and more data could be obtained from the same animals.
Refinement goes further to determine which steps can be taken to minimise any harm that may come to animals.
Of course, in many cases it can relatively easily be argued that animals must be used in ways that are indeed harmful, and commonly lethal as part of the experiment. Moreover, animals are being designed to be ill. There are many variants of lab animals such as mice that are bred to get certain diseases that are to be studied, e.g. diabetes, heart disease, Alzheimer’s, muscular dystrophy, etc.
Sometimes animal data doesn’t apply to humans. The benefit of these experiments must be analysed against the cost of using animals in this way. Doing science creatively and compassionately is a powerful quality.
Microbiology aseptic techniques
Growing microorganisms has been a fundamental element of much of experimental biology, as well as the underpinning of many modern molecular biology techniques. Perhaps we have a sample of earth that we want to analyse to find a new microorganism with antibacterial properties. Perhaps we are testing a patient sample for an infectious agent. Most likely, we are culturing a safe strain of E. colithat has been genetically modified to produce a protein of interest like human insulin that we can isolate from it and administer to patients.
Aseptic means free of contamination. There are hundreds of fungal spores in the air we breathe at all times. There are bacteria and viruses everywhere. If we are to culture Escherichia coli (bacteria, prokaryote), archaea (such as species that can produce methane by metabolising CO2) or perhaps Pichia pastoris (yeast, eukaryote), we’re going to be feeding them some nice nutrients, and chances are, loads of other microorganisms will jump at the opportunity to feast.
We don’t want contamination, we just want our specific species that we are culturing and nothing else. The various techniques employed to this end have evolved through time and can even differ between labs and scientists:
A flame (Bunsen burner) can be used in the close vicinity of handling the target microorganism and related equipment and reagents, in order to make the surrounding air warm up and rise higher, carrying away any contaminants that might be present in the air close to our working space.
The equipment we use can be sterile as bought (e.g. plastic loops in sealed bags) or sterilised by passing it through the flame after dipping it in ethanol (e.g. reusable metal loop). Similarly, the lids and necks of bottles of liquids can be passed through the flame briefly upon opening and closing.
The working area can be cleaned with a 70% ethanol (now slightly changed and called IMS-industrial methylated spirit to make it unfit for human consumption) solution before and after the procedure is done, and to clean any other items as necessary, such as gloves, other items and surfaces, etc.
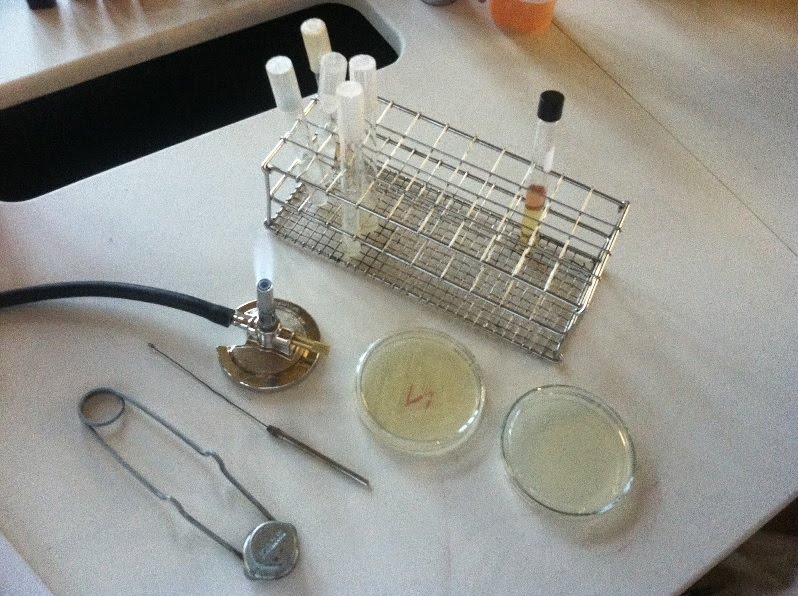
Sidenote: what even is that giant safety pin???
A step up from using a flame is using biological safety cabinets that provide a larger, fully controlled and enclosed working area, which filters the air mechanically to maximise safety and minimise contamination. This also needs to be maintained sterile with ethanol and other cleaning agents, and all samples and equipment kept inside must be separately sterilised with the ethanol solution as they are being used, taken in and out of the cabinet.
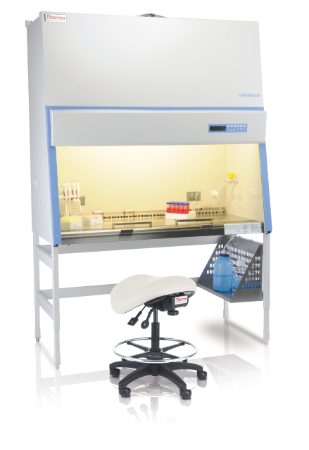
Basically, spray this stuff everywhere.

When finished with thesamples and equipment, another round of safe disposal and sterilisation takes place, even if the microorganism you are dealing with is supposedly safe. You know, precautions and all that.
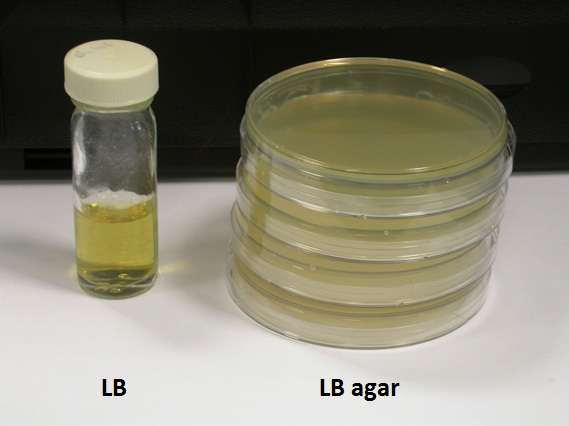
Ok, so we have our glorious sample or microorganism or whatever that we’re about to grow. We grow it using special media, such as LB (lysogeny broth) for bacteria and YPD (yeast extract peptone dextrose) for yeast. These media contain basic nutrients like sugars and amino acids, and encourage microorganisms to thrive.
They can be formulated into liquid form (broth) and incubated in flasks, or into gel (agar) form and incubated in Petri dishes (a.k.a. plates). Selective media exist that specifically stimulate or inhibit a certain type or microorganism, making it easier to identify and isolate what we’re growing.
Microorganisms need an energy source such as chemicals and light, as well as the raw materials to make biological products, They can be capable to constructing all the products needed e.g. carbohydrates and proteins (biosynthesis) from a simple pool of chemicals.
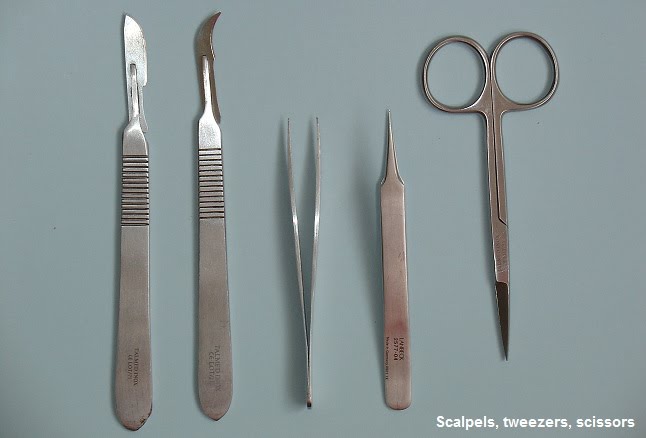
Dissection
Dissecting animal or plant tissue must be carried out safely. Many different tools can be used for dissection and micro dissection, including scalpels, forceps, scissors and clamps.
These instruments must be used carefully to avoid injury to yourself or others. Some experiments, such as those using fresh stem cells, require use of sterile equipment. In such a dissection, the working area and instruments must be disinfected first.
Fieldwork sampling techniques
Sampling of organisms must be like those annoying, attention-seeking Snapchat friends. It must be random. Random sampling can be carried out using quadrats. If you’re wondering what they are, look no further – they’re squares.

How would you make sure that your sampling is random? In a field, you could lay two long tapes perpendicularly to define the limits of the area where the samples will be taken from.
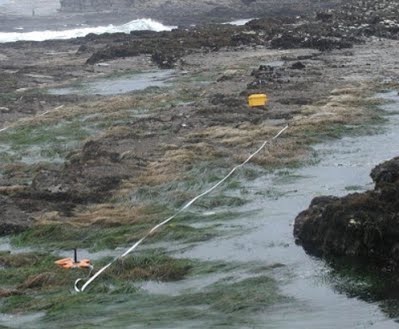
As you can see above, a tape is laid on one side of the sampling area. As you can’t see above, another tape is laid from one end of the first tape, across on the adjacent side of the sampling area (like a giant L). Then two random numbers are generated using a random numbers table. These numbers are used to determine the coordinates of the first quadrat placed on the field, by matching them on the two tapes. And voila! You have yourself a system for random sampling using quadrats.
Transects are tapes (like above) placed across an area which has some form of gradient caused by abiotic factors which directly determines the distribution and abundance of the organisms present. For example, a beach is not suited for random sampling because there are clear zones ranging from the low population zone near the sea, to the more densely inhabited areas further up the shore. In this case the best way of obtaining useful data is by systematic sampling.
After placing the tape across the shore, place quadrats at set intervals such as every 5 metres, then take your data down.
Mobile species such as shrimps can’t be counted by the quadrat method. Instead, they are investigated using the mark-release-recapture method. This is something I personally did on my field trip for A level:
1. Capture shrimps using nets and count them.
2. Mark them by nipping half their tail diagonally (not proud :D)
3. Repeat, ensuring to account for the marked shrimps.
The more marked individuals you get, the smaller the total population is likely to be.
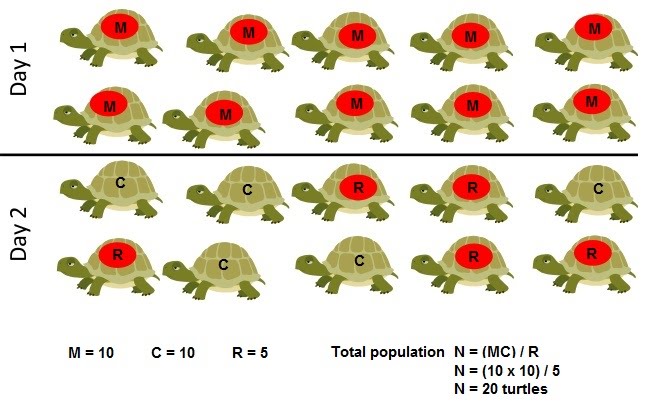
In order to calculate this, we can call the number of initially captured individuals M, and the number of those captured the second time C. The recaptured ones (with the mark) in the second sample C can be termed R.
This gives the equation N = (MC) / R where N is the total number of individuals in the population.
For example, if we caught 45 shrimps, marked and released them; then caught another 45 of which 31 were marked, then the total population would be:
N = (MC) / R
N = (45 x 45) / 31
N = 65.32 [shrimps are whole numbers so round down]
N = 65 shrimps
The total population obtained this way is an estimate that depends on an equal probability for all individuals to be recaptured, and no migration into and out of the population to occur. Juvenile individuals might not be captured, ill individuals might not be captured, or the population might be connected to others, skewing the data from the mark-release-recapture method.
Methods of marking different species include banding, tagging, surgical implantation, painting, hair clipping, etc. Any marking method must minimise impact on the species, both during the marking process but also during subsequent observation through the mark.
Data processing
Various methods exist for processing data, from simple handheld calculators to sophisticated modelling software. Of course, the task at hand will dictate what data processing solution should be used. Microsoft Excel is a popular program for logging data, running computations and presenting it in various graphs. SPSS is another application developed specifically for social sciences which can run an array of different statistical analyses on data sets.

Modelling and programming at a higher level can be achieved via software such as R and Matlab. These programs require training in themselves, so each specific research and data processing task will have its own specific set of software relevant.